
A Facebook Post-Mortem
A Facebook Post-Mortem
Reviewing my analysis and my shortcomings

The company “Meta Platforms” will be called “Facebook” in this piece
Acronyms: DAU = Daily Active User | MAU = Monthly Active User | ARPU = Average Revenue Per User | MAP = Monthly Active Person | ARPP = Average Revenue Per Person
Facebook geographic segments: US & Canada, Europe, Asia-Pacific, and Rest of World
My normal bi-weekly deep dive is being pushed to next Monday, May 16th. It is my last publication before I have to go dark until August due to work obligations and compliance at my upcoming internship. Because of this, I am putting in extensive commitments to ensure the highest quality work comes out from my (temporary) send-off piece. Thank you for your patience!
Facebook’s stock fell by over 20% at its lowest point in the six trading days leading up to its earnings release in April. Poor subscriber data from Netflix and soft social advertising data from YouTube left investors increasingly concerned that the company would struggle with both users and ad rates not just in the first quarter, but also in its forward guidance.
This drop had brought the stock to $169, below the $177 bear price target I had established in February when the stock traded at $220. Because of this, I stated on multiple public channels that despite my dim view of the future of the business, the stock was no longer something I viewed as a favorable short. You can think a business is bad but also think the risk/reward ratio in having a position against the stock doesn’t make sense, this is a great example of such a scenario.

With Facebook’s sharp move to the upside post-earnings, I thought it’d still be worthwhile to revisit my original comments, analyze where I was wrong, and discuss a dataset I have created which may show potential issues for all social media companies deriving their “growth” prospects from outside of the United States. Let’s get into it!
Old Comments
“Efficiency in generating ad sales has become a highlighted issue for Facebook.”
“The churn rate has been growing over the past year, and the current trend is not sustainable for the company. I do anticipate increased spend to limit this as a result.”
The review of old comments will start with those that discuss the margins of the core business, which saw its operating margin decline by 930 basis points in the past year.
First is the topic of Facebook now having diminishing marginal returns on incremental revenue due to higher marginal costs for server/data capacity and leads for sales. While profitability in the core business declined in large part due to massive headcount increases (it should be noted capital allocation has shifted to dramatically slow hiring), underlying margin declines due to the sales process becoming more capital intensive have remained persistent, with COGS growth steadily outpacing revenue growth in Q1.
Cost of revenue in the three months ended March 31, 2022 increased $874 million, or 17%, compared to the same period in 2021. The increase was primarily due to an increase in operational expenses related to our data centers and technical infrastructure; higher costs associated with partner arrangements, including traffic acquisition and payment processing costs; and an increase in content costs.
(Facebook 2022 Q1 10-Q)
Furthermore, growth in marketing and sales costs also outpaced revenue with the company citing the primary causes as increases in marketing and promotional expenses. Facebook is being forced to spend incrementally higher amounts on promotional activity to retain engagement from its users.
The good news for Facebook is that this increased spend has kept users onboarded and blunted the churn rate, more than I expected. However, it means that COGS and marketing & sales have grown as a percentage of revenue by 292 basis points in the past year. It’s accurate to say roughly 1/4 to 1/3 of the margin contraction in the core business is not associated with discretionary hiring/capital allocation decisions from management. I view further investment to limit churn and expand server capacity, particularly as video takes an increasing share of time spent on app, as issues that will continue to pressure core business margins.
“One of the main drivers of Facebook’s failure in this (retention among young users) is its complete capitulation to competitors in rising social media formats and its failure to attract content creators.”
“The reality is simple. Facebook has only ever competed by acquiring and is incapable of organically competing against new media formats. Because Facebook can no longer acquire large competitors due to the risk of regulatory action, it has failed to properly deploy countermeasures against these new media formats that competitors have brought forth.”
Another highlighted point I made was the struggles Facebook currently has with young users and its poor position concerning making its platforms a hub for content creators. Relative engagement has improved in the short-run as a function of the increased spending already discussed as well as major global events like the war in Ukraine elevating engagement in the short-run. However, its key issues with young users and content creators remain.
Young users are still bleeding engagement off of Facebook’s apps as the company still struggles with implementing effective tools to prevent new media formats. This has again been proven in recent months with the rapid success of two new apps among young people, LiveIn and BeReal. While LiveIn is a widget/tool that adds fun, BeReal is a more distinct media format and is the antithesis of the sentiment people have around Instagram. You simply have to “be real” rather than spending time to produce something idealistic as people do for Instagram. I anticipate new competition will continue to be an evolving issue.
The content creator issue is also something I continue to watch closely as I view this as a much larger long-term threat for engagement and monetization than the current noise around TikTok and IDFA. Despite the company’s continuing shift towards video as the primary method for user’s time on app (which is good for monetization and engagement), as well as its success in integrating algorithmic suggestions onto Instagram feeds, its inability to have a bottom-funnel platform suitable for creators continues to be a long-term issue.
On the creator/influencer side, Meta reinvested $1B in a creator fund to help build out Reels adoption. Asked in the follow-up to the earnings call, Wehner would note that whilst revenue share (popular with YouTube creators) is being experimented with, they “don’t think revenue share will be the predominant model”. (Investment Talk Newsletter)

As these points highlight, revenue-sharing is incredibly difficult on short-form video and is an inherent weakness of the media format. While short-form is great in user retention as the average attention span has decreased, it cannot inherently create an incentive structure suitable for creators to dedicate careers to platforms around it unless they achieve massive scale.
The other issue is that the “creator funds” short-form apps have are fixed amounts, meaning that as views on the platform go up, the revenue per view a creator gets declines precipitously. The lack of an ability to find an answer to this problem means that short-form apps will continue to face an inherent retention drain as creators seek to pull the audiences they obtain to other platforms where they can be more easily monetized. As content creators continue growing in relevance, this issue will become increasingly important for top-funnel platforms in general.
Where I Was Wrong
This is a post-mortem, so I would be remiss if I didn’t discuss where I was wrong over the past few months so I can learn and strive to improve.
Firstly, I was wrong by being overly pessimistic about churn and user growth. This is consistent with my recognition that my original prospectus on items may be overly optimistic or pessimistic depending on the direction of the thesis I have. I hope that as I continue to learn through the remainder of my college career, gain more reps, and obtain more professional experience I can improve on my initial analysis rather than checking myself while updating priors at the level I currently am.
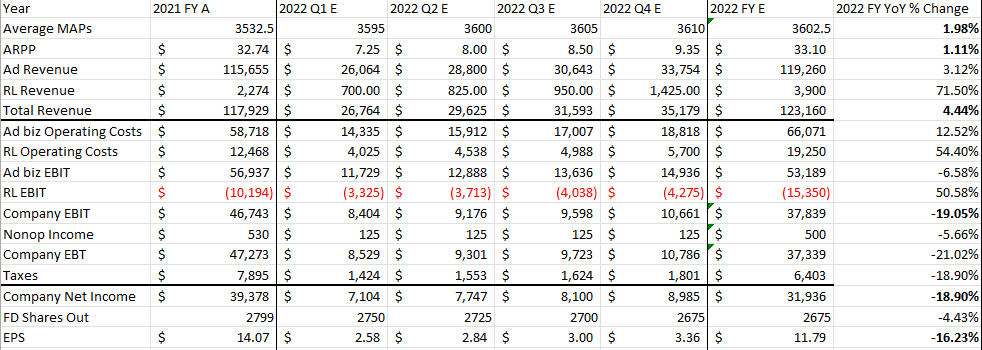
With this knowledge, the churn rate I ascertained in my original update is likely too high. 21% is likely not an accurate annualized churn rate for MAUs across the Family of Apps and the 15% level is likely closer to being correct. The result is a higher MAP/MAU level than my original model projected.
I was also incorrect in my assumptions around ARPU/ARPP. While my thesis on ARPU compression (not related to IDFA) has been correct as data shows ARPU is down YoY for the company on its non-Facebook apps, I was too harsh in my first analysis. Advertising revenue per monthly active person came in at $7.42 vs my expectation of $7.25.
These factors led to me underestimating revenue by over $1 billion for the quarter. I was also incorrect in overestimating operating losses for Reality Labs by almost $400 million in the quarter. This was offset by margin issues in the core business being far worse than myself or the street forecasted. Family of Apps EBIT came in at $11.484 billion in the quarter, below my own $11.729 billion estimate and missing the street consensus by over $1 billion.
When putting my errors together, my EBIT estimate for $8.404 billion was off by under 2% and was well ahead of the street’s consensus. My miss on EPS was mostly a function of non-operating income being more than normal as well as some variations in the company’s tax rate. However, with the number of errors made in my original model, this was a function of me being cluelessly correct. I will strive to become more precise as I continue to learn and improve.
Is The American User Over-Monetized?
With the post-mortem done, I wanted to discuss a new piece of data I worked to compile. While the math, in this case, is specific to Facebook, this topic is applicable to every social media company with substantial user bases outside of the United States. I’ve asked many times whether the US is over-monetized by social media companies compared to other geographic regions but have not seen good data to analyze this question, at least none that are public.
To solve the question myself, I took the ARPU of each geographic segment and divided it by the population-weighted GDP per capita of every geographic region to get a monetization rate per capita of each of Facebook’s geographic segments.
Note: All population, GDP per capita, and ARPU data is from 2020 due to the current extent of data availability for all required countries
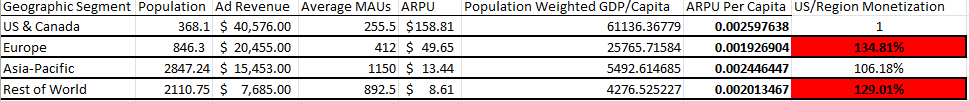
The results show that on a per capita basis that the US is over-monetized compared to Europe and Rest of World (which is Latam, the Middle East, and Africa) in a statistically significant manner. The same would be the case in Asia-Pacific, but China’s population and GDP per capita are excluded due to Facebook’s apps being banned in the country, so it’d be unfair to include it in this analysis.
There are weaknesses in this analysis. For example, this does not include time spent on Facebook’s apps per region due to this not being publicly available in a way I can discover with my current resources. However, the fact it is on a population-weighted per capita basis does sort out some of the issues like advertiser propensity to spend and discretionary income by region.
I won’t be the sole arbiter of the conclusions this data draws as I’m sure there are many different perspectives. In my opinion, the data does give me concern for all social media companies that state monetization growth in non-US markets as a revenue/profit driver. This is because this data could indicate that the monetization growth rates in these regions may not be what these companies anticipate over time due to the potential for the US to be monetized at a rate not matchable in other regions.
Nextdoor is a particular victim of this with Europe being stated as its main growth driver. Europe is the region with the worst monetization disparity and has been coupled with the war in Ukraine blunting advertiser spending. My report discussing problems with Nextdoor here
I’ll conclude by saying that the immediate reaction to Facebook’s stock was not unjustified by any means. It’s important to know that a perceived weak business can be a good (or not bad) stock, just as a good business can be a bad stock.
Despite most of my concerns remaining accurate, I was wrong on finer details of my original analysis, in part due to a bias to be overly convinced on a primary thesis. This is something I will aim to refine by putting even more work into the companies I’m working on, being more receptive to thoughts that run against my own parallel, and taking advantage of probabilistic scenario analysis to think in odds more accurately.
I have an endless amount to learn and am still at the starting line of what I hope to be a very long career in investment management/asset allocation once I graduate next year. I hope my writing is a fun way to show my process and skills growing as my learning in and out of the classroom continues and I look forward to where this road may take me.
Have a great week, see you on the 16th for my last publication until August!
- Strat
Disclaimer: I hold no position in Facebook/Meta Platforms as of the time of publishing, will not take a position in the stock within the next two weeks, and am receiving no compensation to write this article.
I think the issue with FB is that it is 100% an advertising model. This produces some real risks.